

Hot Spots in the Area Lead to Skyrocketing Land Prices
Land prices on the Gold Coast more than tripled in the 12 months to March and rose 19.7% nationally, the fastest annual growth in 18 years, fueled by supply shortages and strong demand.
Land values also rose sharply in Sydney, Melbourne and Hobart, where average land prices rose 43.5 per cent, 31.7 per cent and 47.6 per cent respectively, the HIA-CoreLogic Residential Land Report shows.

HIA senior economist Nick Ward said: “The unusually strong increase in residential land prices shows that land supply is not keeping up with the new demand that has emerged during the pandemic.
“Constrained land supply will limit housing activity in greenfield areas from mid-2023 onwards.”
The average price of a plot of land in south Brisbane, Adelaide Central and the Hills and Launceston districts has more than doubled in the past 12 months, up 110.1% respectively; 175.7% and 126.5%.
The average value for plots in Melbourne’s inner south has increased by 72.1%. They increased by 32.2 per cent in the north-east and 46.7 per cent in Geelong.

Per square meter, Hobart posted the biggest price increase, up 34.9%, followed by Sydney’s 30.6% increase.
Melbourne increased by 26.4%, Adelaide increased by 12.5% and Perth increased by 4%. But prices in Brisbane have fallen by 13.9 per cent. This is the only capital to record a decline in land prices per square meter during this period.
Land prices will decrease
Sydney remains the most expensive capital city, with an average price of AUD 1682 per square meter, followed by Melbourne at AUD 1044. Perth is priced at 702 AUD/m2, Adelaide 588 AUD, Brisbane 499 AUD and Hobart 448 AUD.
But rising construction costs and delays by builders, combined with multiple interest rate hikes and tightening lending conditions, may have dampened demand for land, said CoreLogic economist Kaytlin Ezzy.
“Due to a lag in land price data, the current data set shows a 19.7% year-on-year increase in land prices to March excluding any recent interest rate increases, which have put significant downward pressure on house prices in recent months.” Miss Ezzy said.
“As land data for recent periods becomes available, we will likely see reduced land demand, which could put downward pressure on land prices.”
Mark Bainey, chief executive of Capio Property Group, said land prices in some areas of Sydney had fallen.
“We are seeing development land availability fall by at least 15 per cent from the peak of the market in some areas of Sydney,” he said.
“There are not many investors willing to buy land at the present time, so there will be less price tension, leading to lower land prices.
“As developers and builders, we are being hit by rising construction and financing costs at a time when home valuations are decreasing, which makes pre-sales difficult. Most developers depend on pre-sales and if they don’t get pre-sales, they won’t have the financing to build, which will ultimately lead to less supply.”
Lower demand pulled land prices down 5.1% compared to the third quarter in Sydney’s outer suburbs and Blue Mountains and 11.6% in Melbourne’s northwest.
In regional areas, average land prices increased by 16.3% to AUD 256,050.
The Gold Coast in Queensland is the reddest in the region, with an average price of AUD 1,188,000, followed by the Mornington Peninsula in Victoria at AUD 870,000 and Richmond-Tweed in NSW at AUD 720,000.
Related articles

Treasurer Jim Chalmers officially announced the 2026 Australian Federal Budget, focusing on reforming the tax system and enhancing national security in the context of inflation and global geopolitical turmoil. Housing Policy Reform The government focuses on addressing the housing and tax system to support the younger generation (Millennials and Gen Z) through systemic changes. From […]
The Federal Government has officially announced its 2026-2027 budget, with reforms to Australia’s real estate, tax system and increased housing supply aimed at helping more Australians own their homes. Support home ownership and increase supply Australian property tax reform: Change regulations on negative gearing and capital gains tax (CGT) incentives. The changes are estimated to […]
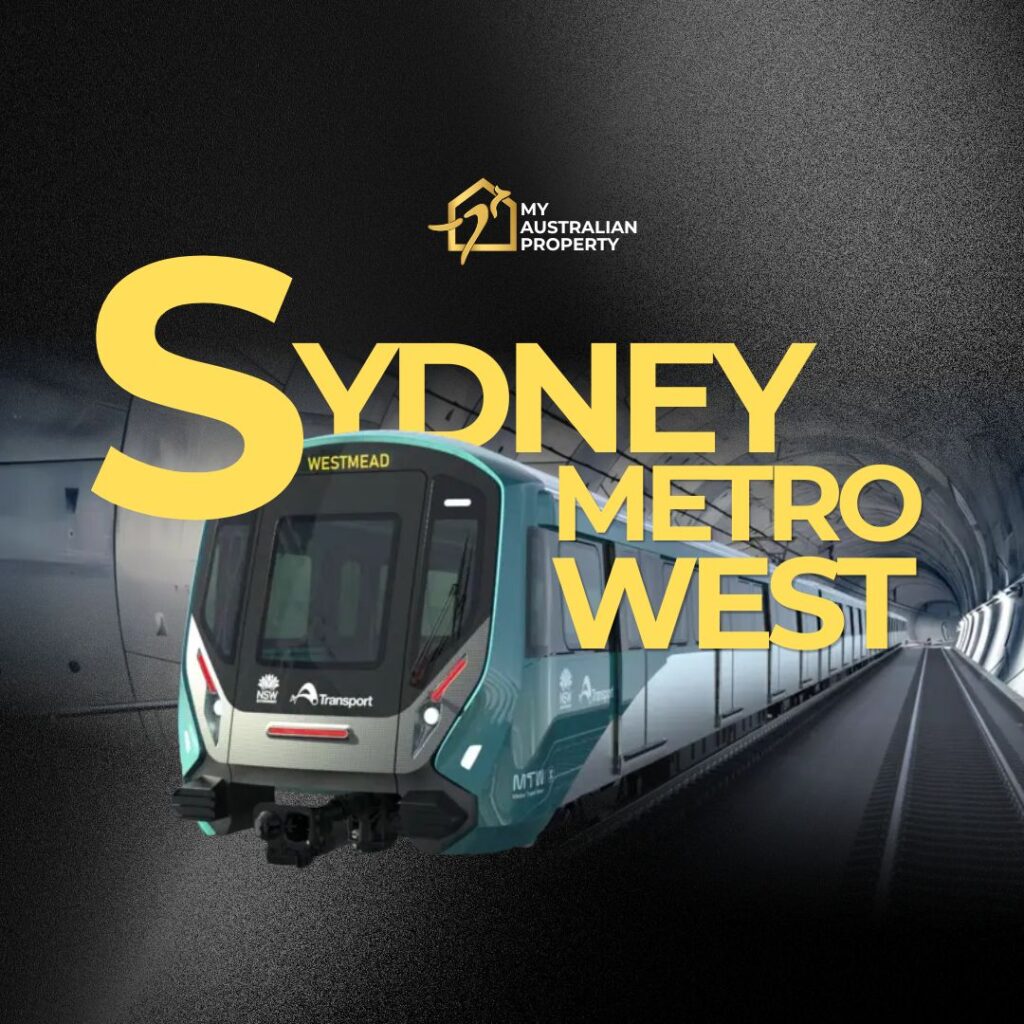
The birth of the Metro West line is not simply a transportation solution; it is symbolic of Sydney’s transformation into a connected megacity. With a record investment of up to 27.3 billion Australian dollars, the project promises to unlock the potential for tens of thousands of luxury apartments, turning areas along the route into the […]